
Grofit Discuss a diagnosis

Grofit — an advisor agent for your customer base Are we growing, or living off new customers?

observation In the demo company, growth rests on last year’s wave of customers: without it, revenue would have fallen by ₽0.4M. Diagnosis sample, PDF

It asks the questions about your customer base that nobody in the company asks.

Grofit brings the reports of marketing, CRM, product and finance into one picture of your customer base. It tells you whether the base is growing or being eaten away, and says plainly what is proven by calculation and what is still a guess.

forheads of marketing, CRM, product and finance, owners and top management

  • No data needed for the first step
  • No customer names or phone numbers
  • About a week
Grofit’s questions· Example Co. demo data
  1. How many customers in the old base still buy?

    observation 3,000 → 2,300, ≈ −23%. No department report shows this.

  2. Do new customers come back less often than last year’s?

    observation Buying in month 6: 36% → 31%. Over their first 6 months each one brought ₽1,575 → ₽1,367.

  3. Why do new customers bring in less than last year’s?

    hypothesis — test it The orders don’t show the reason: a different channel, or a first-order discount? Add the first-order channel and Grofit will compare.

The numbers come from formulas on the data, not from a language model.

question“Every department reported growth. Where do we take the next quarter?”

Departments report one thing, the base shows another

The demo company “Example Co.”, 2024 → 2025: four correct reports and one picture of the customers.

What departments report

  • Marketing

    New customers per year

    ≈ +20%

    2,000 → 2,400

  • CRM

    Revenue from returning customers

    ≈ +67%

    ₽0.3M → ₽0.5M

  • Product

    Revenue per active customer

    ≈ +11%

    1,354 → ₽1,502 a year

  • Finance

    Company revenue

    ≈ +8%

    ₽10.0M → ₽10.8M

observation What the customers show

  • Active customers in the old base

    ≈ −23%

    3,000 → 2,300

  • Revenue per acquired customer over the first 6 months

    ≈ −13%

    ₽1,575 → ₽1,367, observed months only

  • Growth rests on last year’s wave

    +₽1.2M

    In its second year it brought in ₽1.2M more than the wave before it. Without that, revenue would have fallen by ₽0.4M.

Every report is correct, and none of them shows the main thing. Grofit gives every department the same premises from the same data. hypothesis — test it If this continues, in 2026 this source will stop growing.

How Grofit turns the departments’ proposals into one decision

Revenue grew by +₽0.80M; the maturing of last year’s wave added +₽1.20M. Acquisition adds up to almost zero: +₽0.59M from the number of new customers and −₽0.58M from revenue per customer. Retention of the old base took away −₽1.00M. Three proposals are on the table: a first-order discount, post-purchase emails, a two-step repeat order.

  1. 01 · One axis

    Every proposal is measured with the same yardstick

    • per buyer
    • per email recipient
    • per active customer

    → second purchase per acquired customer by month 6

  2. 02 · Owners

    Every bet has its own owner

    Marketing
    first-order discount
    CRM
    post-purchase emails
    Product
    two-step repeat order
  3. 03 · Conflicts

    The effects don’t add up

    • double countingTwo teams can both claim the same second purchase.
    • riskA discount can bring cheap first orders with weak repeat buying.
    • hypothesisWhat worked can’t be seen in the orders — it gets tested, not calculated.
  4. 04 · Decision

    The executive signs off

    Grofit compares the proposals on one axis. The next step is a test your team runs with its own tools; its result can be added and compared on the same axis.

    Grofit doesn’t change priorities or budgets.

signal from Grofitsignal → evidence → decision

Three situations every executive knows

What the numbers show and what to check first. The executive decides.

01An owner without analysts

Signal

Revenue is up, there are more new customers — so all is well?

Emails are run by a contractor, reports by one person in Excel.

Evidence · observation

The old base is melting; growth rests on last year’s wave

Old base

4.1 → 3.5

New this year

3.2 → 3.2

Last year’s wave, its second year

2.4 → 3.6

Returning

0.3 → 0.5

Total, ₽ M

10.0 → 10.8

2024 → 2025 · demo data

Decision

Watch three numbers every quarter

How many new customers came, how much each brought in over the first six months, how many customers of the old base still buy. If only the first one grows, you are living off new customers.

Prepared by
Grofit
Decides
the owner

02A first-order discount or a post-purchase sequence

Signal

Marketing wants a first-order discount, CRM wants an email sequence

Each shows growth in its own report. There is one budget.

Evidence

One axis for both

Discount cohorts side by side with full-price cohorts, at the same age.

Decision

Your team runs the test

With its own tools. You add the result, and Grofit compares it on the same axis.

Owners
marketing and CRM
Signs off
chief commercial officer

03The average grows, the base weakens

Signal

An active customer spends more: ≈ +11%

₽1,354 → ₽1,502 a year per active customer in the old base.

Evidence · observation

There are fewer active customers

The average was lifted by those who stayed — the same selection effect as in the example below.

Decision

Retention first, then the average

Compare cohorts at the same age. Grofit accounts for price growth separately.

Prepared by
CRM and product
Signs off
chief commercial officer

question“Why is the average growing if fewer people are buying?”

The same orders, two correct numbers

A separate demo example: 100 customers who first bought in the same month. A year later we divide the same revenue by different people.

One group 12 of 100 bought · ₽40,500 separate example

bought that month did not buy that month

Month 12 · group revenue

₽40,500

The numerator is the same. Only the denominator changes.

per buyer

₽3,375

₽40,500 ÷ 12

≈ +160%

per original customer

₽405

₽40,500 ÷ 100

≈ −69%

Separate demo example · 1 dot = 1 customer · sorted by revenue in month 0

Grofit · conclusion

Those who stayed did not spend more: the average grew because of selection, while the group’s revenue fell.

A growing average can also mean rising prices. Grofit accounts for inflation and the business’s own price increases separately.

Starting and final values of the separate 100-customer example
MetricMonth 0Month 12
Bought that month10012
Group revenue for the month₽130,000₽40,500
Revenue per buyer₽1,300₽3,375
Revenue per original customer₽1,300₽405

question“What do I get after the diagnosis?”

One document every department understands

The conclusion in plain words on top, three analyses below. The calculations for analysts are collapsed and included in the PDF sample.

Customer base diagnosis
Company
Example Co.
History
36 mo.
Status
sample

demo data

Main conclusion · observation

Growth rests on last year’s wave: in its second year it brought in ₽1.2M more than the wave before it. Without that, revenue would have fallen by ₽0.4M. More new customers come in, but each one brings in less.

hypothesis — test it If this continues, in 2026 this source will stop growing.

Download the diagnosis sample (PDF)

Two pages you can forward to your CFO without blushing.
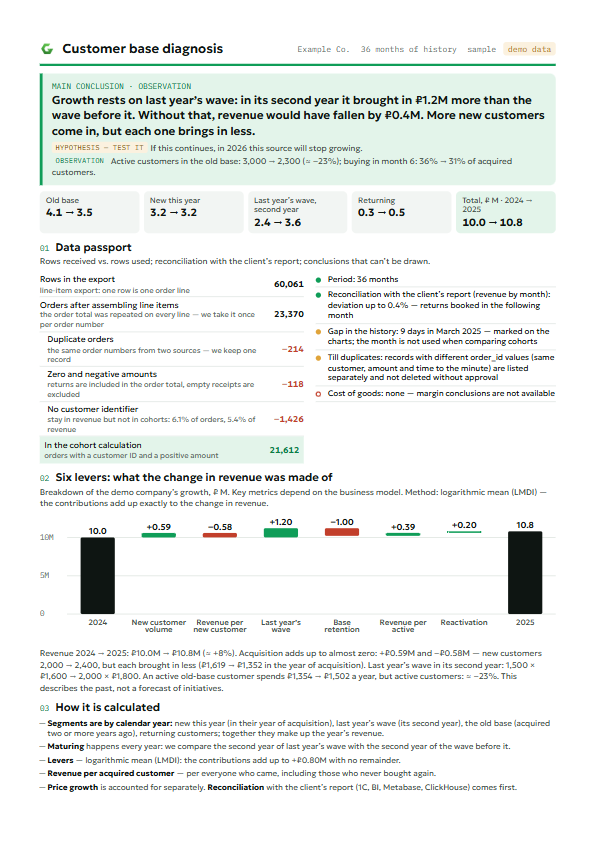
First page of the diagnosis sample: the main conclusion in words, what revenue was made of, the export row funnel and the waterfall of growth levers

Data check · before any conclusions

  1. rows in the export60,061
  2. orders23,370
  3. duplicates−214
  4. zero amounts−118
  5. no customer ID−1,426
  6. in the calculation21,612

Reconciliation with the client’s report: deviation up to 0.4%. Orders without an ID stay in revenue but not in cohorts.

Where the diagnosis starts · three analyses

  1. Retention by month of acquisitionHow many customers from each acquisition month still buy after 3, 6 and 12 months.
  2. Reverse cohort analysisCustomers are grouped by the month they left, and their first months are compared: the good ones are visible from the very start.
  3. Loyal coreIf long-standing regular customers change their behaviour, either the market or the business itself has changed.

Grofit picks the applicable analyses itself: purchase frequency doesn’t matter for fur coats, and order value doesn’t matter for a single-plan subscription. If data is missing, it says exactly what is missing and suggests adding it.

For analysts · calculations behind the sample

01Data passport: exclusion rules and caveats
  1. Rows in the export60,061line-item export: one row is one order line
  2. Orders after assembling line items23,370the order total was repeated on every line — we take it once per order
  3. Duplicate orders−214the same order numbers from two sources — we keep one record
  4. Zero and negative amounts−118returns are included in the order total, empty receipts are excluded
  5. No customer identifier−1,426stay in revenue but not in cohorts: 6.1% of orders, 5.4% of revenue
  6. In the cohort calculation21,612orders with a customer ID and a positive amount
  • Period36 months
  • Reconciliation with the client’s reportrevenue by month: deviation up to 0.4% — returns booked in the following month
  • Gap in the historya 9-day gap in March 2025 — marked on the charts; the month is not used when comparing cohorts
  • Till duplicatestill duplicates with different order_id values (same customer, amount and time to the minute) are listed separately and not deleted without your approval
  • Cost of goodsnone — margin conclusions are not available

usable with a caveat no conclusion possible

There is no such thing as perfect data: Grofit cleans the export and shows what it excluded and why.

02Six levers: an example of breaking down growth, 2024 → 2025

The money waterfall of the demo company. The key metrics are chosen for the business model — another company will have its own levers. One customer takes part in several levers, so the chart shows roubles, not people.

Contributions of the six levers, ₽ M
Revenue, 2024₽10.0M
New customer volume+₽0.59M
Revenue per new customer−₽0.58M
Maturing of last year’s wave+₽1.20M
Retention of the old base−₽1.00M
Revenue per active customer in the old base+₽0.39M
Reactivation+₽0.20M
Revenue, 2025₽10.8M
  • New customer volume — 2,000 → 2,400 acquired
  • Revenue per new customer — ₽1,619 → ₽1,352 in the year of acquisition
  • Maturing — the wave’s second year: 2023 — 1,500 × ₽1,600, 2024 — 2,000 × ₽1,800
  • Retention of the old base — active customers 3,000 → 2,300
  • Revenue per active customer — ₽1,354 → ₽1,502 a year

Grofit · how to read it · observation

Revenue grew by +₽0.80M (≈ +8%). Acquisition adds up to almost zero: +₽0.59M and −₽0.58M. Growth rests on last year’s wave: without it, revenue would have fallen by ₽0.4M.

This describes the past; it is not a forecast of what future initiatives will deliver.

03Conditional horizon of the base you already have

When, under unchanged conditions, revenue from customers who bought before the cut-off date falls to half of the base quarter. The line includes no new customers, so this is not a forecast of company revenue. Unit: ₽ M per quarter.

Years of history: 2023 · 8.4 / 2024 · 10.0 / 2025 · 10.8 ₽ M — 2024 and 2025 are the same as in the levers. The 9-day gap in March 2025 is marked on Q1 2025.

Grofit · scenario

Base quarter: ₽2.57M; half: ₽1.29M. Under these assumptions, revenue from the base you already have halves by quarter 4 after the cut-off.

If the history is short or has gaps, the report says so directly: the horizon can’t be estimated reliably yet.

Scenario assumptions

  • no new customers in this line
  • retention and spend by customer age — as in the history
  • seasonality — as in the history
04Cohorts by month of life: roubles per acquired customer

A row is a cohort, a column is the customer’s month of life. Each cell shows roubles per acquired customer, including those who never bought again.

observation First 6 months, cohorts that lived through all of them (12 and 7): ₽1,575 → ₽1,367 (≈ −13%) per acquired customer; buying in month 6: 36% → 31%.

expectation First 12 months: ₽2,250 → ₽1,875 (≈ −17%); buying in month 12: 31% → 26%. The 2025 cohorts have not lived 12 months yet: the missing months are filled in from the profile of earlier cohorts. This is an expectation, not a fact.

Hatched cells are months the young cohorts have not lived yet: “not observed yet”.

05Conflicts and owners
  1. Whose second purchase is it — the discount’s or the emails’?

    owners: marketing, CRMone axis; the test — with the team’s tools

  2. Why do new customers bring in less in their first year?

    owner: marketingadd the first-order channel

  3. Why are there fewer active customers in the old base?

    not a single department’s question — the executive decidescohorts at the same age

06How it is calculated
  • Segments are by calendar year: new this year (in their year of acquisition), last year’s wave (its second year), the old base (acquired two or more years ago), returning customers. Together they make up the year’s revenue.
  • Maturing happens every year: we compare the second year of last year’s wave with the second year of the wave before it.
  • Levers are decomposed with the logarithmic mean method (LMDI): the contributions add up to the change in revenue with no remainder, +₽0.80M.
  • Revenue per acquired customer — per everyone who came, including those who never bought again.
  • Prices. We check growth in average order value against price growth: inflation and the business’s own price increases are accounted for separately.
  • The formulas are open. Your analysts won’t have to assemble this by hand: the PDF sample has the tables and formulas.

The order history shows what changed, but doesn’t prove why.

question“Where do we start, and what do you need from us?”

Getting started: three steps

  1. 01

    A conversation

    We discuss the question and check whether the data fits. The data itself isn’t needed yet.

  2. 02

    The export

    Four fields, at least 24 months of history, 36 is better. No names, phone numbers or addresses.

    customer_id,order_id,date,amount
    7f3a…c1,100482,2024-03-02 14:10,4 250
    7f3a…c1,101977,2024-05-19 09:41,3 100
    b21e…09,100513,2024-03-02 18:22,1 890

    customer_id can be a hash · amount — after discounts and returns · check your file ↓

  3. 03

    Diagnosis

    We go through the document: what is proven, what is a hypothesis, what data is missing.

    guidelineabout a weekafter a usable export and an agreed question

What works as input

  • An order export from 1C, a CRM or a CDP, including line-item exports.
  • A loyalty card or a phone hash — that is your customer ID.
  • If the export has a channel, a point of sale, a promo code or a subscription flag, the diagnosis will show breakdowns by them.
  • No developer, SDK or API keys needed.

We don’t draw an overall conclusion if fewer than half of the orders have a customer ID or the history is shorter than 24 months.

Reconciled with your numbers

Before any conclusions, we reconcile revenue and orders by month with your report from 1C, BI, Metabase or ClickHouse. Any deviation comes as a number, with its cause.

Your analysts won’t have to assemble this by hand — the formulas are open, and we reconcile with your BI before any conclusions.

Grofit is not a CDP, not a mailing tool, not BI

  • We don’t send emails or launch campaigns.
  • We change nothing in your CDP or CRM.

It is an external business analyst: it calculates, shows and highlights the main changes in your customer base.

Every number comes with its formula

≈ −69%= (₽405 − ₽1,300) ÷ ₽1,300

“Not enough data” is an answer too

Why did customers stop buying in March?

Not enough data. The orders show that there were fewer purchases, but not why. If there was a promotion or a delivery failure, tell us or add that data, and we’ll check.

question“I have a file with me — will it work?”

Check your export in a minute

We find the columns, assemble line items into orders and show the row funnel. This is a format check, not a diagnosis.

The file is not uploaded — the check runs in your browser

Example output · line-item file, as exported from Mindbox

The export works for a diagnosis: 30 months of history, 89% of orders have a customer ID.

Row funnel

  1. Rows in the file2,322
  2. Orders after assembling line items1,161
  3. Zero and negative amounts−1
  4. No customer ID (kept in revenue, not in cohorts)−129
  5. In the cohort calculation1,031

Columns found

  • Customer IDcustomer_id
  • Order IDorder_id
  • Dateorder_date
  • Amountorder_total

Period: Jan 2023 — Jun 2025 · customers with an ID: 300

  • Line-item export: the order total was repeated on every row — we took it once per order, so revenue isn’t double-counted.
  • No orders in these months: 2024-03. We mark such months and don’t use them when comparing cohorts.

Discuss a diagnosis

Let’s start with a conversation

We’ll check whether your order history shows the main risk to growth.

Price and data

We name the price after the first conversation, before you hand over any export.

You send the export securely, under a contract; after the pilot we delete it on request.

Who is behind it

Viktor Krylov · author of the methodology

Head of Product, CDP at Beeline; ex-CPO Exponea; ex-CMO Samokat

2186.ru
Order history optional

— required fields

questionfrequently asked questions

The essentials in brief

How is Grofit different from Mindbox or another CDP?

A CDP stores profiles and runs communications. Grofit changes nothing in your CDP: it takes an order export and shows what your revenue is made of.

Why not just ask ChatGPT?

A model will answer confidently even where the data has no answer. The numbers are calculated not by a language model but by formulas on your data, and every conclusion is labelled as an observation, a hypothesis or a scenario.

Will Grofit replace BI or an analyst?

No. Grofit is an external business analyst for your customer base. Your analysts won’t have to assemble this by hand: the formulas are open, and we reconcile with your BI before any conclusions.

How much does it cost? Is it a service or consulting?

It is a pilot with the Grofit team involved; the result is the diagnosis document and a walkthrough of it. We name the price after the first conversation, before you hand over any export.